Studio
In the previous chapter, we explored ell’s powerful versioning and tracing capabilities. These features provide a solid foundation for managing and analyzing your Language Model Programs (LMPs). However, to truly leverage the full potential of this data, we need a tool that can visualize and interpret it effectively. This is where Studio comes in.
Studio is a powerful, open-source visualization and analysis tool that complements ell’s versioning and tracing capabilities. It runs locally on your machine, ensuring data privacy and security. Studio provides an intuitive interface for exploring LMPs, their versions, and interactions, transforming the abstract data collected by ell into actionable insights.
With Studio, you can visualize the evolution of your LMPs over time, analyze the performance and behavior of your prompts, debug complex interactions between multiple LMPs, and collaborate more effectively with your team on prompt engineering tasks. In essence, Studio turns the wealth of data collected by ell’s versioning and tracing systems into a powerful asset for prompt engineering, all while keeping your data local and under your control.
Launching Studio
To start using Studio, run the following command in your terminal:
ell-studio --storage ./logdir
Then go to http://localhost:5555 to access the Studio interface.
This command opens the Studio interface in your web browser, using the data stored in the specified directory (which should be the same directory you specified when initializing ell with ell.init(store=’./logdir’)). Since Studio runs locally, you can be assured that your sensitive prompt data never leaves your machine.
Key Features of Studio
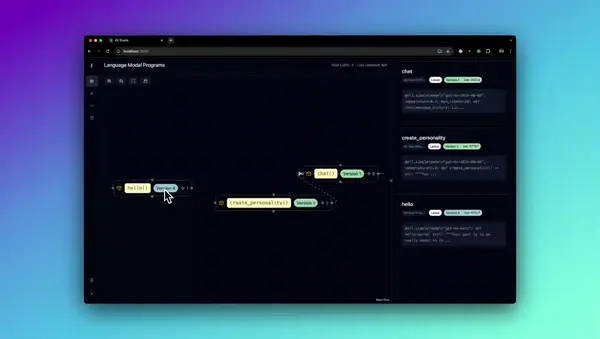
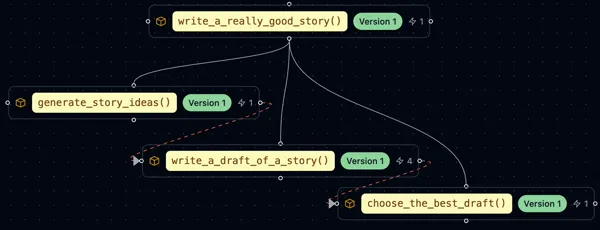
LMP Visualization
Studio offers a comprehensive visual representation of your LMPs and their dependencies. This feature allows you to visualize the structure of complex, multi-LMP programs, understand the interactions and dependencies between different LMPs, and identify potential bottlenecks or areas for optimization in your LMP architecture.
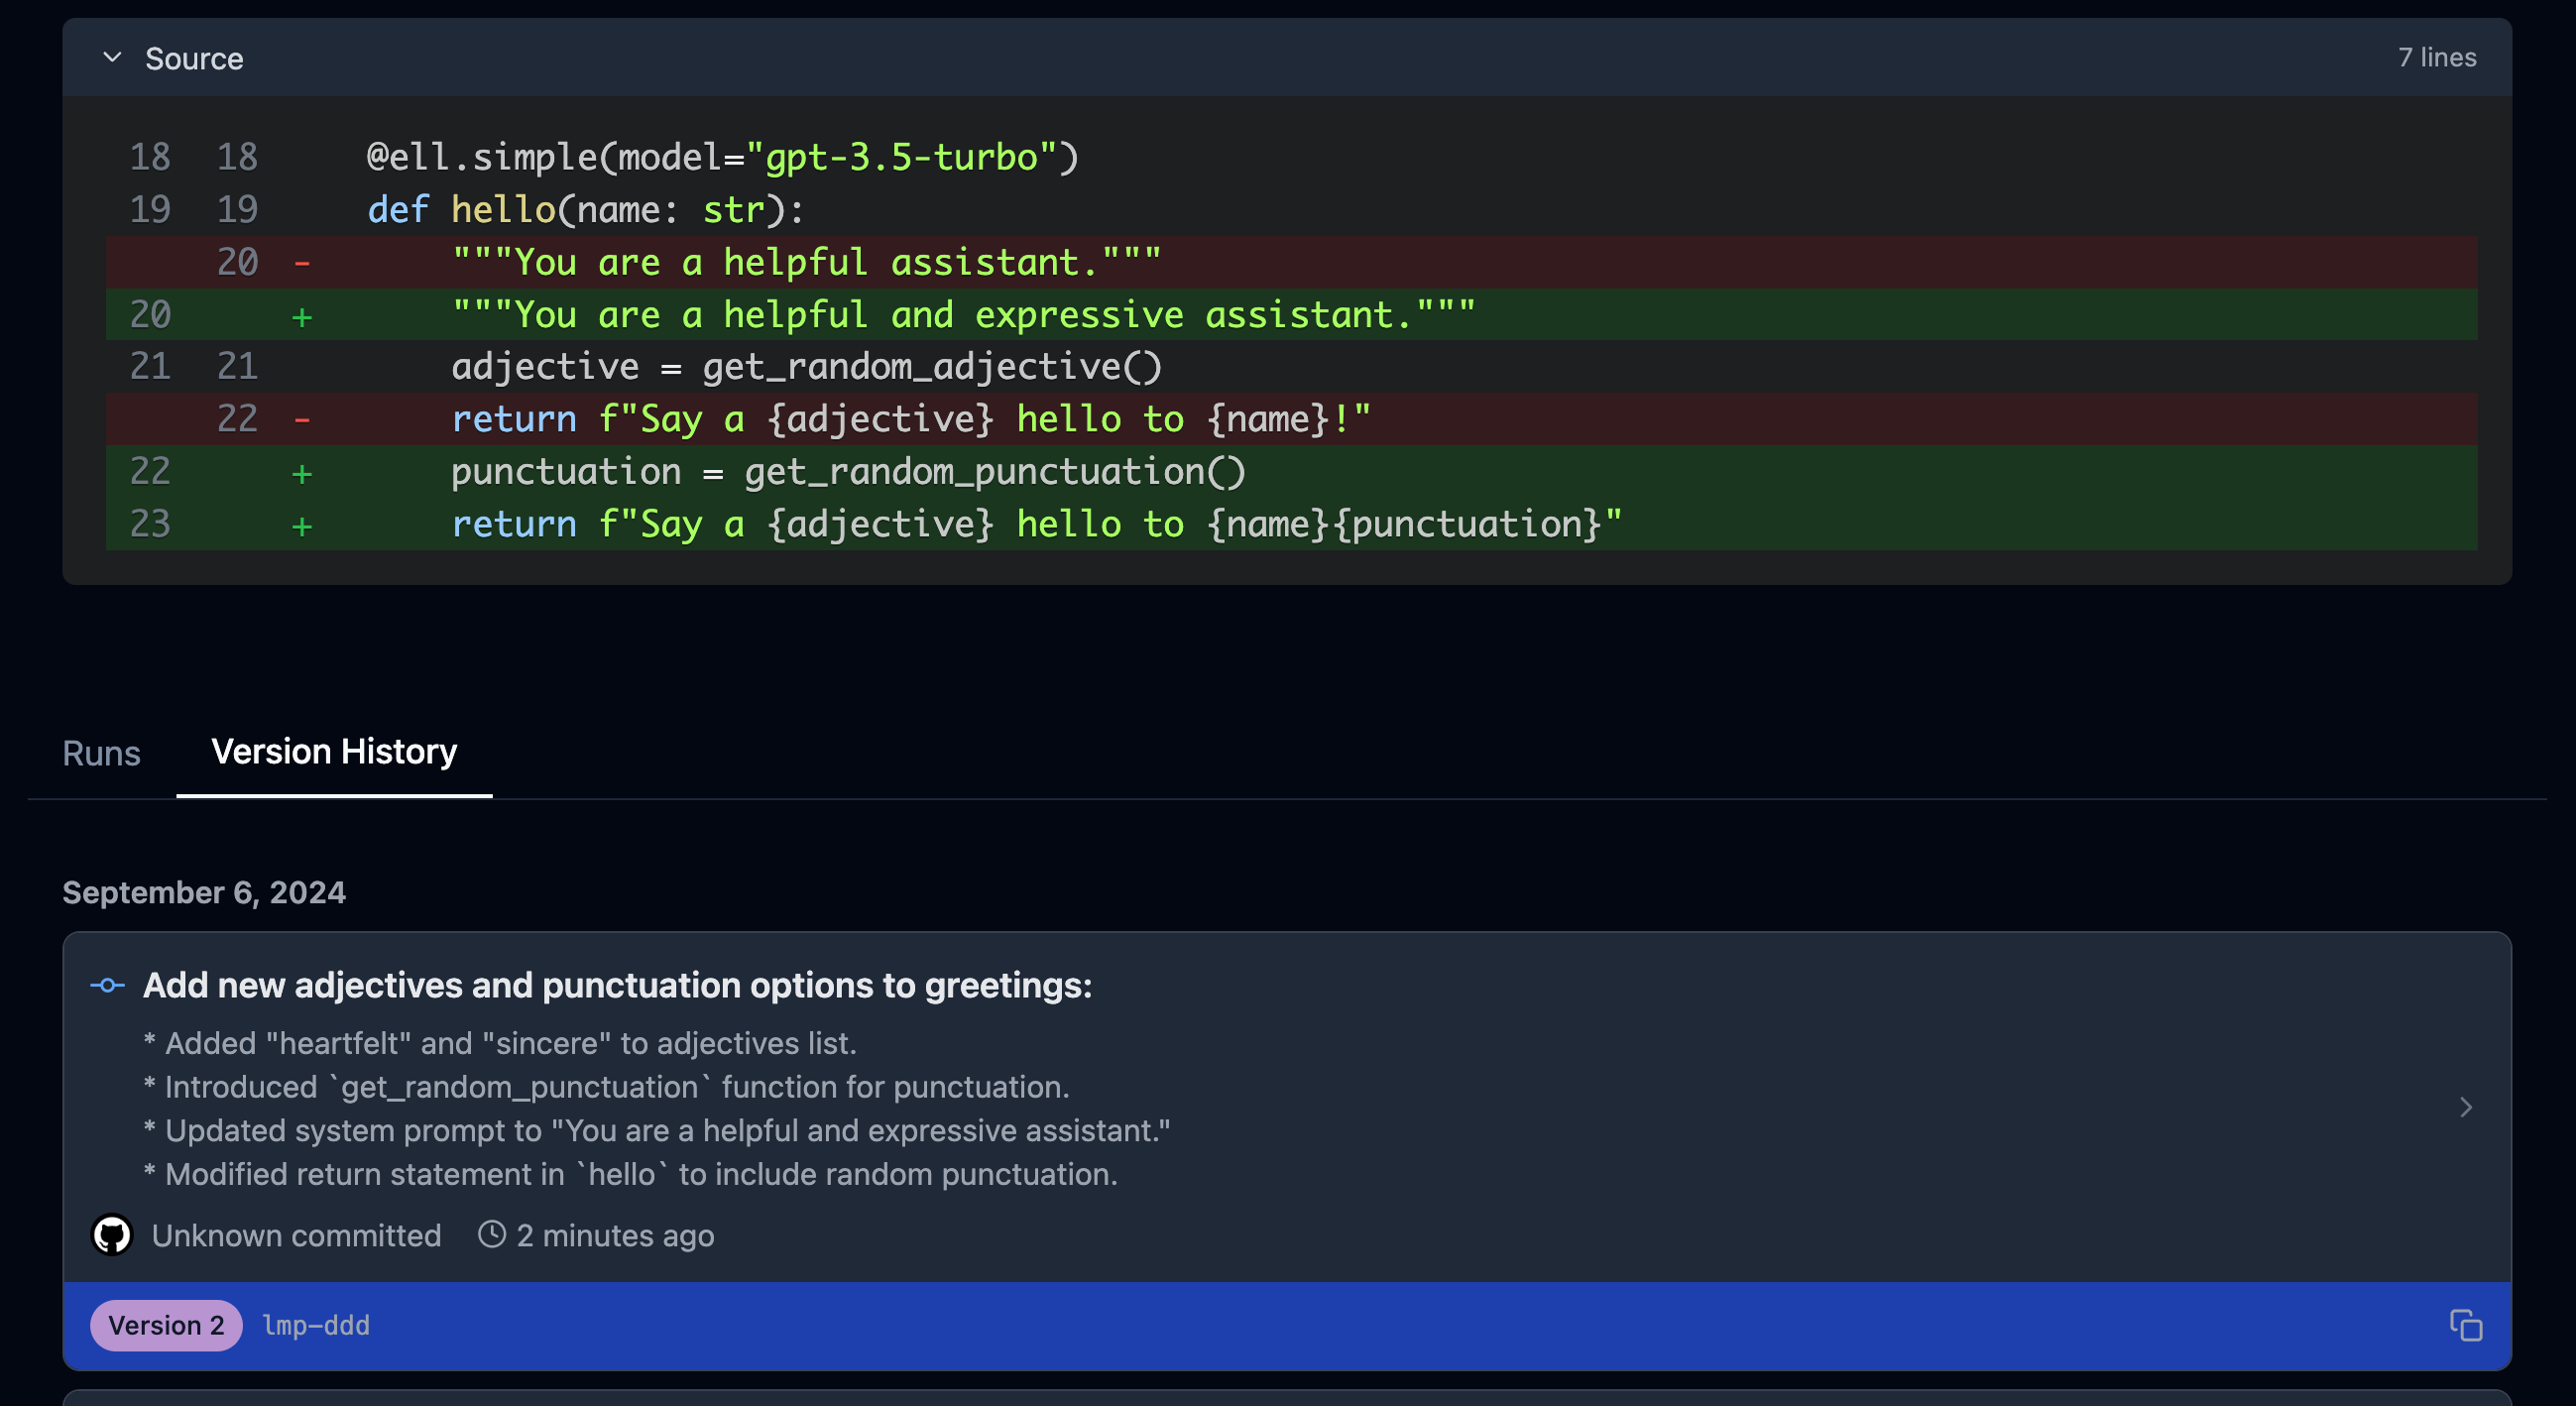
Version History and Comparison
Leveraging ell’s automatic versioning capabilities, Studio provides a complete version history for each LMP. You can perform side-by-side comparisons of different LMP versions and view auto-generated commit messages explaining changes between versions. This feature is particularly useful for tracking the evolution of your LMPs over time and understanding the impact of specific changes.
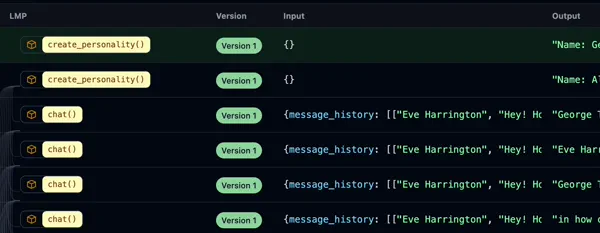
Invocation Analysis
Studio offers detailed insights into each LMP invocation, including input parameters, output results, execution time, and token usage metrics. It also provides tracing information showing data flow between LMPs. This level of detail allows for in-depth analysis of LMP performance and behavior.
Performance Metrics
To help optimize your LMPs, Studio provides various performance metrics such as token usage over time, execution time trends, and frequency of invocations for each LMP. These metrics can be invaluable in identifying performance bottlenecks and areas for improvement.
LMP Viewer
Studio includes a built-in code viewer that allows you to examine the source code of your LMPs. You can compare different versions side-by-side and access the full context of each LMP quickly and easily.